
Let’s be honest. Events aren’t just about networking.
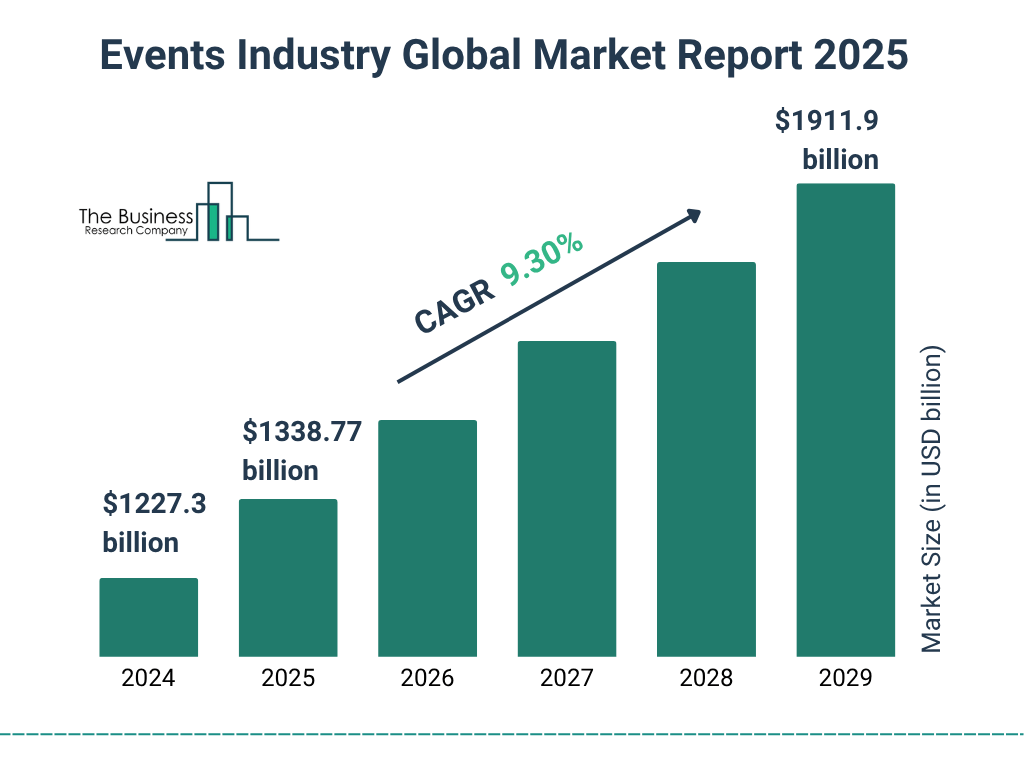
The global events industry's expected to reach top $1.346 trillion after 2025, fueled by in-person engagement and smarter data strategies.
That's why today’s top event leaders don’t rely on gut feelings. They rely on data. Metrics are the story of your event - how it performed, who it reached, and what kind of results it brought. But with so many numbers available, the real question becomes:
Which event metrics actually matter?
Nearly 79% of event organizers say event technology has a significant impact on event success.
Let’s look at the top event KPIs that every event professional should track — and how tools like Bear IQ make it easy to see those numbers in action.
Event metrics are measurable data points that show your event’s performance. They track everything from attendance and engagement to ROI and revenue impact.
And event metrics are wildly important. Over 85% of event professionals now use analytics software to collect and visualize these insights. Data-driven event programs consistently outperform those relying on manual tracking.
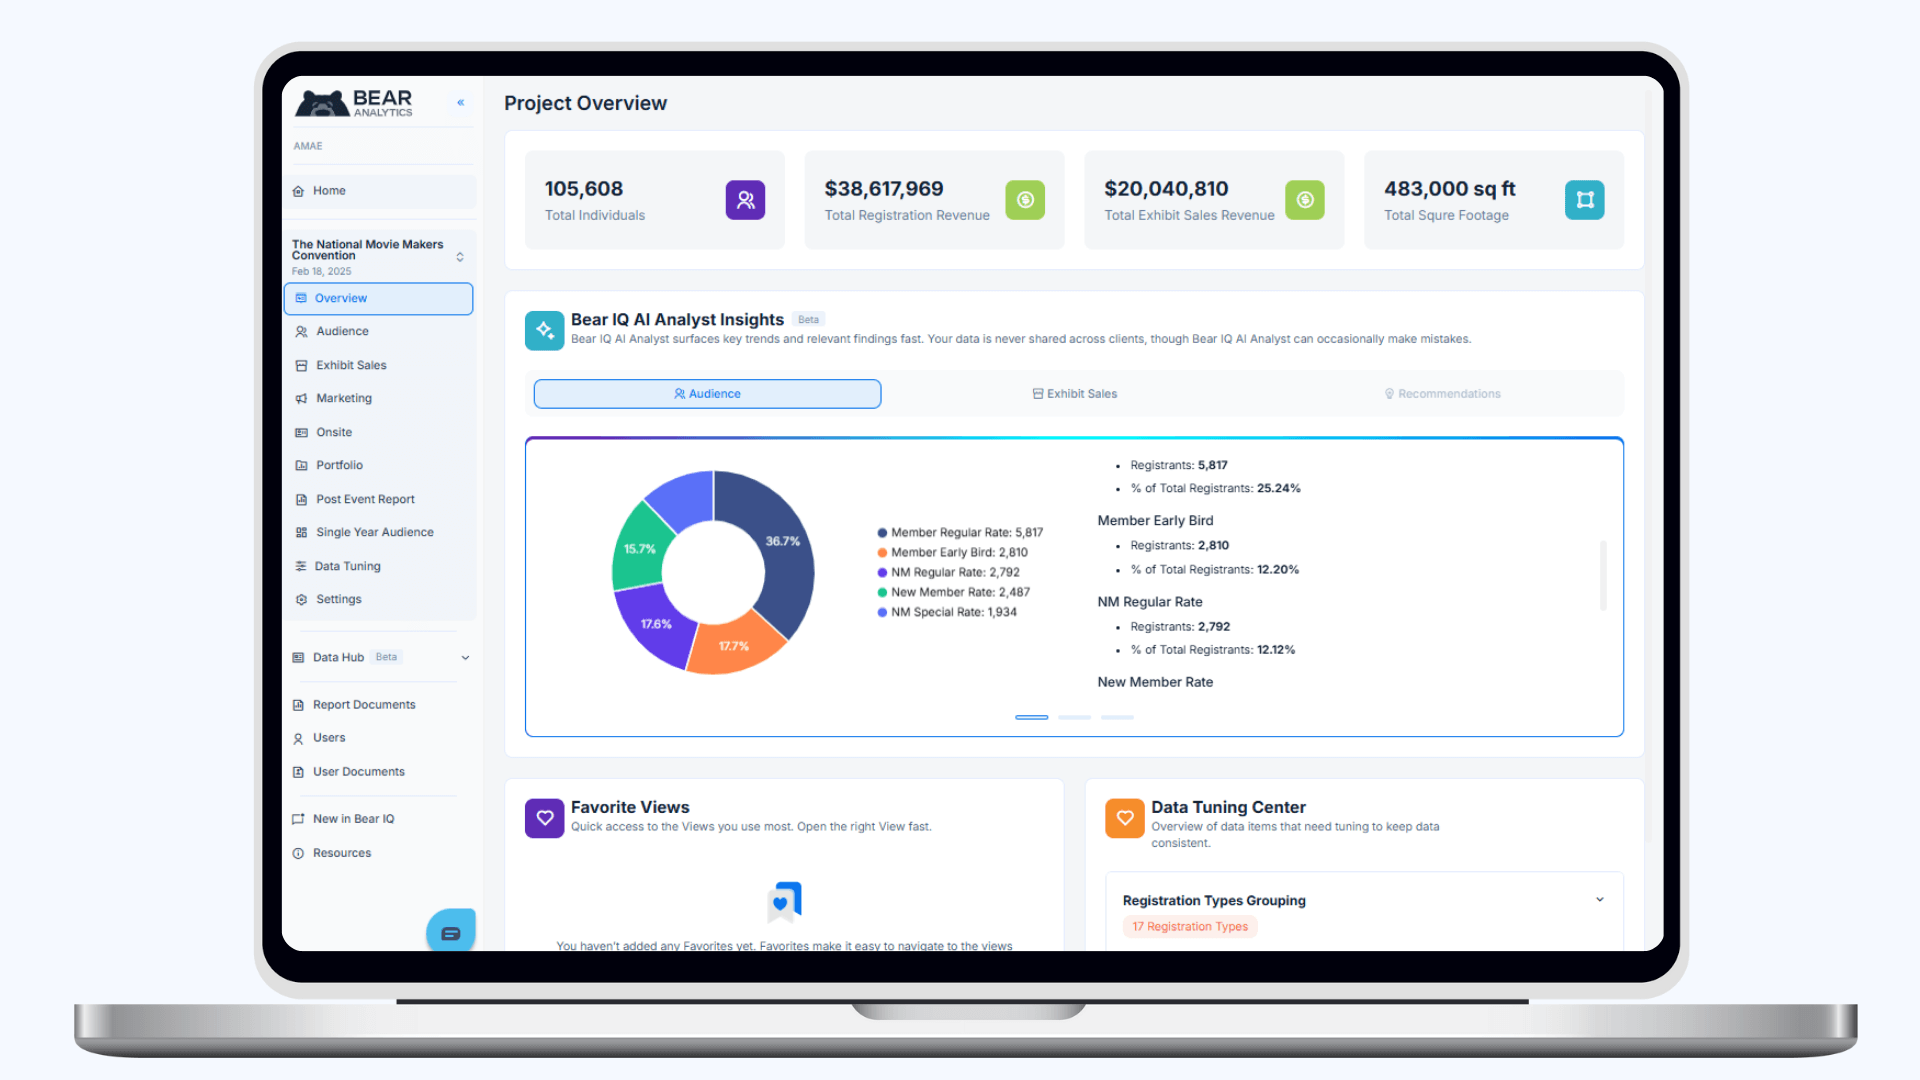
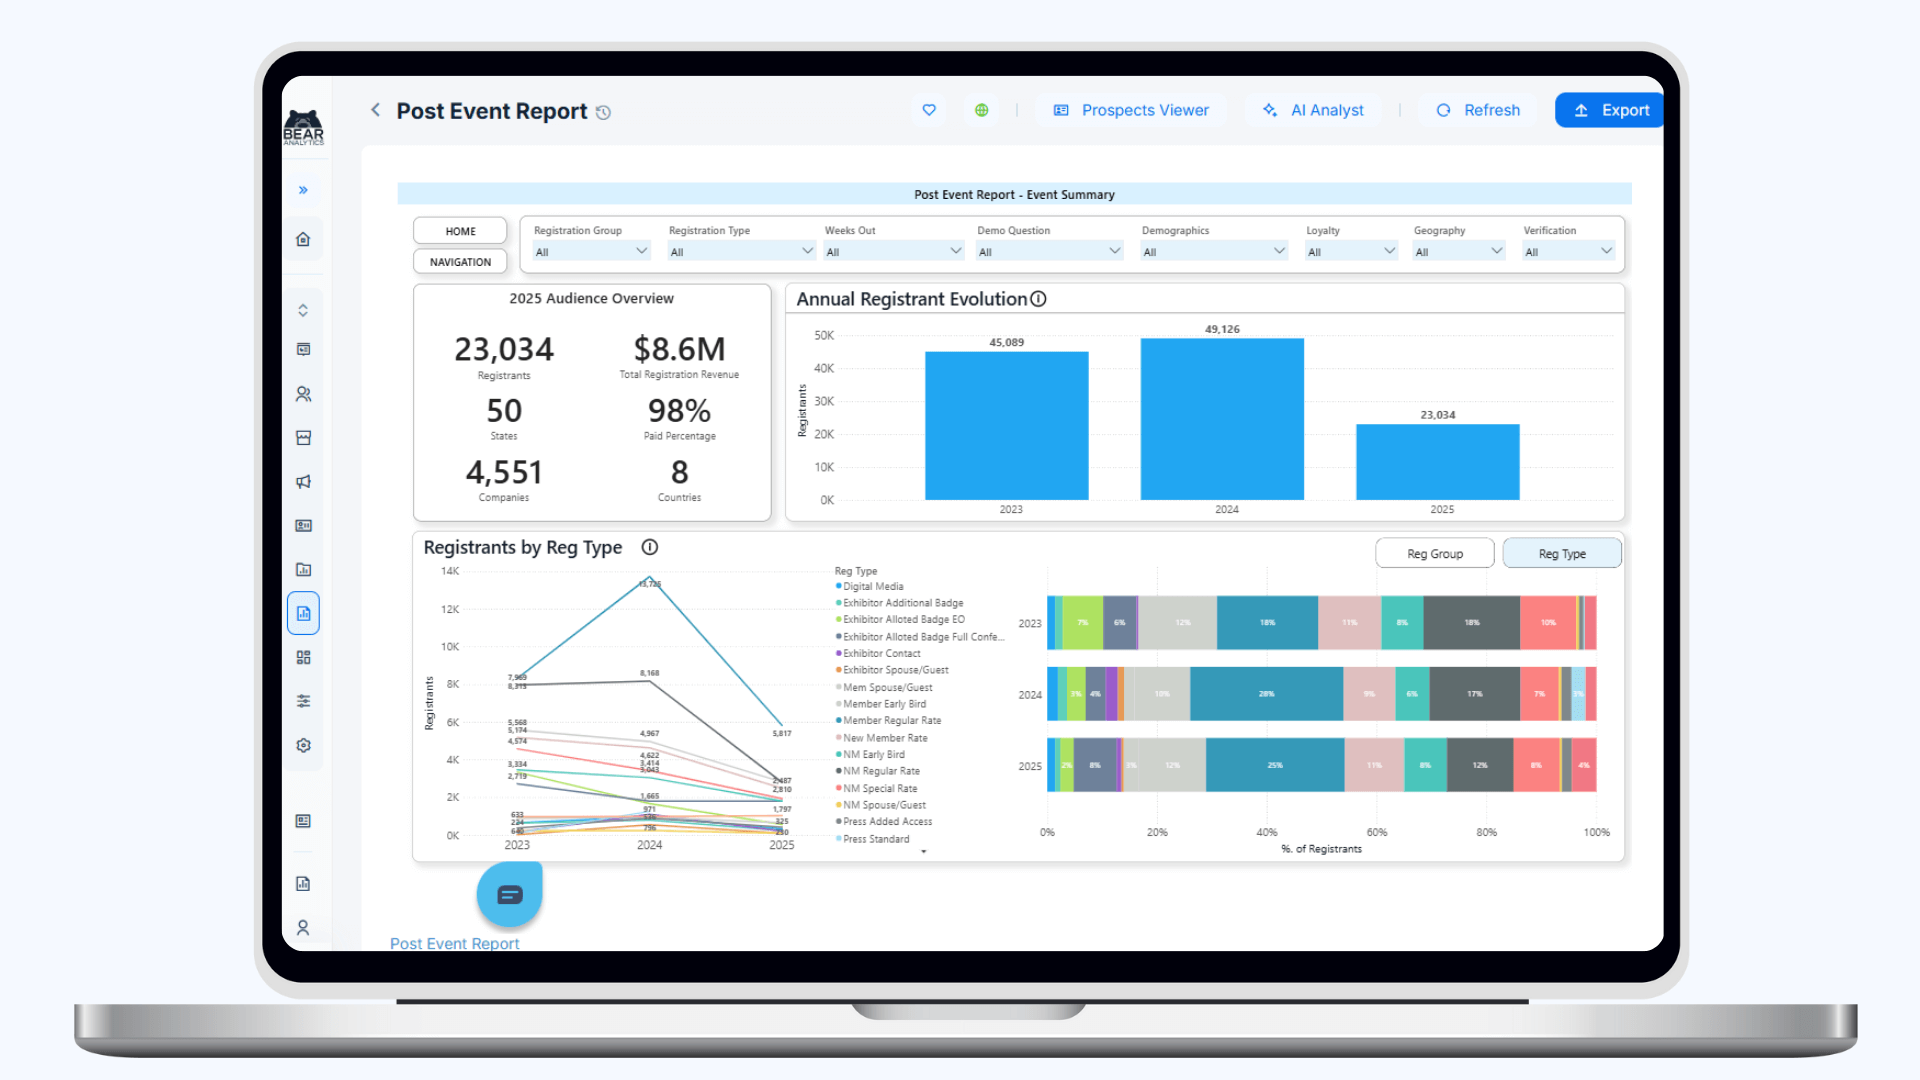
For example, inside the Bear IQ platform, event metrics are clustered into modules - Audience, Exhibit Sales, Marketing, Onsite, and Post-Event - giving event leaders one consistent source of truth (with the manual data-collection headache).
But what about KPIs?
Event metrics are the raw numbers like attendance, leads, and revenue.
Event KPIs (Key Performance Indicators) are the goal-based measures that show progress toward success.
Let's take a look at the differences.
Jot these down. Because according to the Events Industry Council, standardized KPIs are essential for benchmarking across programs and proving ROI.
Audience performance sets the tone for every other metric. Here's what you'll want to keep tabs on in your events around audience and registration.
Metrics to track:

Bear IQ visualizes these KPIs, making it simple to identify where your registrations are surging — and where more marketing support might be needed.
Engagement measures how attendees connect with your event experience. Here's a look at how that engagement plays out in your event data.
Metrics to track:
For in-person events, engagement data drives ROI. Don't skip this one: a whopping 64% of attendees say they want personalized and interactive experiences. Tracking engagement reveals whether your content and floor design deliver on that expectation.
A reminder for event profs: your exhibit floor is both a relationship engine and a revenue driver. Here’s how to see what’s really happening across your sales and floor activity.
Metrics to track:
These are important event metrics to know about for event teams to identify growth opportunities (not only before the show, but during and after as well).

Your marketing data tells the story of pipeline acceleration. Here’s what to look at to understand which campaigns are actually working.
Metrics to track:
These are important because data-connected marketing campaigns generate 25% higher ROI than those using manual tracking.

ROI and revenue metrics show the bigger picture of event performance. Here’s where to focus to understand financial impact.
Metrics to track:
Event ROI metrics aren’t just for reports. They’re helping the whole industry grow. The event market’s growing at about 9% every year because more teams are tracking what works and proving real results.
Now let's chat about many event professionals' favorite KPI! Conversion metrics help you see how interest turns into action. Here’s how to track movement through each stage of the attendee journey.
Metrics to track:
In Bear IQ, conversion metrics tie back to engagement, so teams can see which experiences create the highest downstream impact.
It’s important to know what happens after the show ends. Post-event analytics show if people stay interested, come back for future events, or keep engaging with your content. That’s how you measure long-term impact and real audience growth.
Metrics to track:
It's important your post-event analytics show behavioral patterns, like which audience segments re-register or engage with content after the show.
For those of us managing more than one event, it’s all about the bigger picture. Here’s what to track to understand growth and performance across your full portfolio.
Metrics to track:
Portfolio reporting gives leadership a clear view of momentum and opportunities across the entire program.
So, how are event metrics measured effectively?
Manual event metric measuring is time-consuming, and sometimes impossible. Instead, start with unified data. Bear IQ connects registration, sales, marketing, and onsite systems to visualize performance in one dashboard.
To understand how to measure an event's success, ask 3 questions:
Tools like Bear IQ help you connect the dots from engagement to revenue — without exporting endless spreadsheets.
It's no wonder nearly 70% of event marketers rely on dashboards to make faster, data-driven decisions.
A well-designed event metrics dashboard turns complex data into simple insights.
Bear IQ’s modules (Audience, Exhibit Sales, Marketing, Onsite, and Portfolio) create a 360° view of performance. Think of it as a single pane of glass for all your event data insights. Leaders can keep an eye on progress toward KPIs, forecast trends, and share visual reports across teams.
When your metrics are clear, your strategy becomes proactive — not reactive. It's powerful stuff.

Metrics are important, but decisions are what actually drive growth.
When you deeply and clearly understand your event success metrics, you can fine-tune content, optimize engagement, and prove value to leadership. The goal isn’t to track everything. It’s to focus on what truly drives results.
Ready to see your event KPIs in action? Try Bear IQ.
You can visualize registration trends, engagement rates, exhibit performance, and ROI — all in one dashboard. Even better, you can explore Bear IQ free with your own data to see how your metrics stack up.
Start measuring smarter at BearAnalytics.com
If you've got more questions or thoughts, we're always happy to chat. Or, check out this event metric FAQ below.
A KPI in events is a measurable goal tied to success, like attendee engagement, registration revenue, or lead conversion rate.
Event ROI metrics compare total revenue or influenced pipeline to event costs using the formula (Revenue – Cost) ÷ Cost.
Examples include registration count, engagement rate, lead scans, and booth revenue.
Event metrics are measured through connected data from registration, CRM, and analytics tools like Bear IQ.


.png)
.png)
Stay informed of market impacting events through the lens of Bear and learn about our latest offerings.


.png)